The graphics debugging tool formerly known as PIX has been integrated into Visual Studio for a while now, and gets better in every release. But unlike Xbox PIX, the Windows incarnation of this technology has until now been only for debugging and not profiling. It provided lots of information about what happened, but none at all about how long things took.
For Windows Phone 8.1, my team (hi Adrian!) added the ability to measure and analyze GPU performance. I’m particularly proud of the fact that, thanks to our efforts to make the Windows and Phone graphics stacks as similar as possible, we were able to build this new feature focusing mostly on Phone, yet the resulting code works exactly the same on full Windows. Visual Studio is even able to reuse a single version of our GPU performance analysis DLL across both Windows 8.1 and Phone 8.1.
Rong’s talk at the Build conference shows this in action, and you can download Visual Studio 2013 Update 2 RC to try it out for yourself.
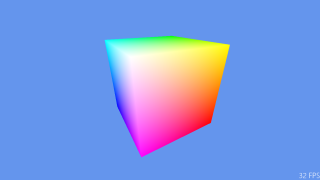
Here’s how it works. I opened the default D3D project template, which gives me an oh-so-exciting spinning cube plus a framerate counter in the bottom right corner:
To use the graphics diagnostics feature, open the Debug menu, click Graphics, and then Start Diagnostics:
This will run the app with D3D tracing enabled. Press the Print Screen (PrtSc) key one or more times to capture the frames you want to analyze. When you quit the app, Visual Studio will open its graphics debugger. This will look familiar if you have used PIX before, but the UI is considerably improved in this release, plus it now supports Phone as well as Windows:
So far so good, but where is this new profiling feature? Select the Frame Analysis tab, and click where it says Click here:
Our new analysis engine will whir and click for a while (the more complicated your rendering, the longer this will take). When everything has been measured it shows a report describing the GPU performance of every draw call in the frame:
This simple app only contains two draw calls. Event #117 (DrawIndexed) is the cube, while #137 (DrawIndexedInstanced) is the framerate counter. There would obviously be a lot more data if you analyzed something more complicated, in which case the ID3DUserDefinedAnnotation API can be used to organize and label different sections of your rendering.
The blue bars near the top (labeled Time) show how long each draw call took for the GPU to execute. Clearly our cube is much more expensive than the framerate text (although both are ridiculously quick – this template isn’t exactly stressing my GPU :-) The column titled Baseline shows the numeric duration of each draw, and the other columns show a series of experiments where we changed various things about the rendering and measured how much difference each one made to the GPU. For instance this data tells us that:
There are a couple of different forms of color highlighting going on in this report:
Move the mouse over any of these numbers to a view a hover tip showing more data about that particular measurement.
“Sounds great! So what types of device can I use this stuff on?”